Stop Chasing Scattered Data
Consolidate revenue and customer data from across all of your key source systems, delivering a finance approved, single source of continuous truth.

Unlock Superior Revenue Quality
0%
Time Savings on Monitored Data Accuracy
0x
Faster Segmented Analytics and Insights
0+hrs
Saved Per Month With Reporting Automation
Streamline Processes
Streamlined Inputs
Consolidate All Sources of Revenue Data
No more complex system of revenue products, data compilers, and siloed reporting. Stop spending too much time manually managing data and analytics.
Accessible Data Output
Automate Revenue Bridge Generation
Spend more time on analysis. Pivot and Projection ready, consumable by Finance, Analytics, RevOps, Accounting, and Data Rooms. Reports can be downloaded directly in multiple formats, or pushed to a data warehouse via API.
Persistent Monitoring
Ensure Data Accuracy, Automate Anomaly Detection
Initiate a continuous process for ongoing anomaly detection, data health checks and exception reporting to ensure historical data never atrophies and new data is always up to your highest standards.
Strategic Positioning
Align Metrics Across Company Stakeholders
A single source of truth to ensure the right stakeholders have access to the data they need for confident, strategic decision making.
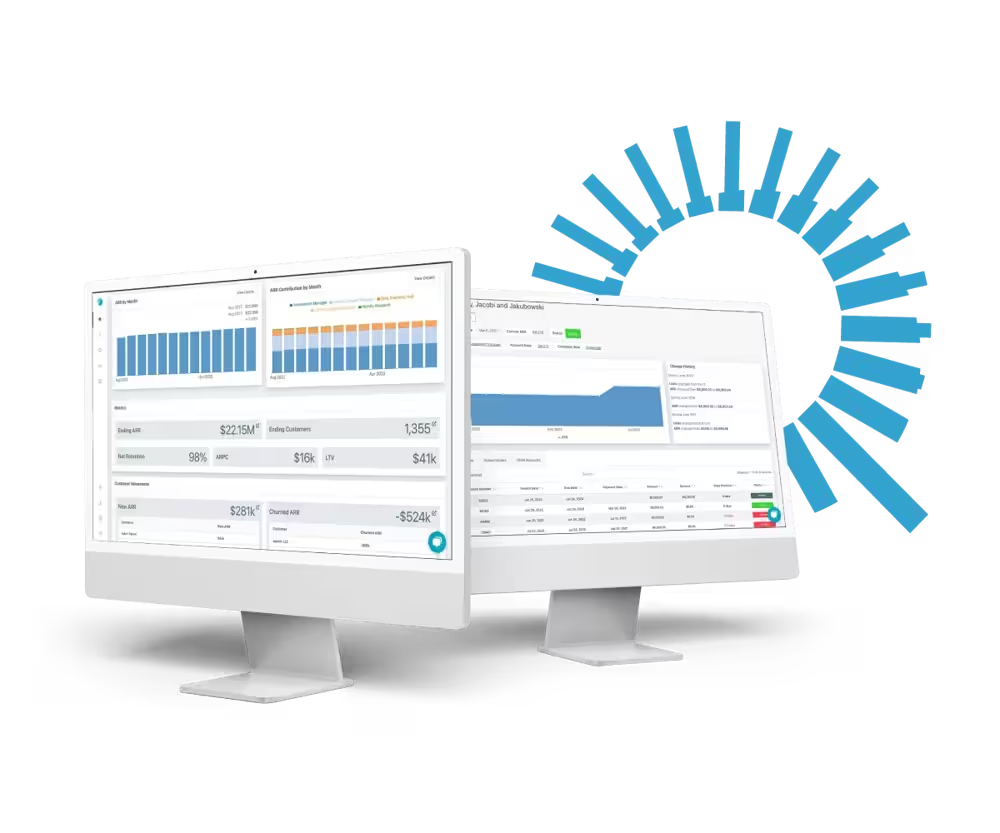
Adapts to your business logic and best practices
Powered By AI-Enabled Adaptive Rules Engine
Our rules engine layers on your existing system, perfectly adapting to your unique business processes. Avoid a costly and time-consuming data cleanse, our platform requires minimal disruption and maximizes efficiency.
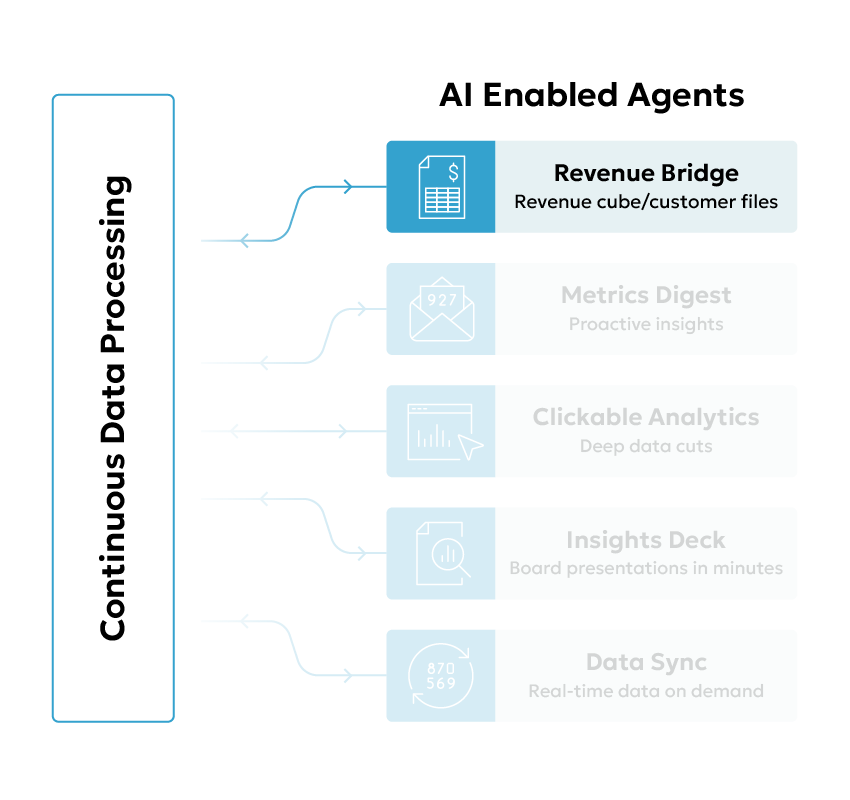
Automated Daily Outputs
Get Started with Revenue Bridge
Revenue Bridge is the first step in connecting your data with our AI-enabled agents. Working with your existing systems, revenue bridge consolidates your disparate data systems to deliver an up-to-date, accurate view into your revenue.
Features:
-
Refreshes Data, Reviews Accuracy, Delivers Outputs
-
Automates cohort and segment tagging leveraging metadata (e.g. Rep, Region, Product) via intelligent business logic (e.g. Customer Size, Product Count).
-
Pivot and Projection ready, consumable by Finance, Analytics, RevOps, Accounting, and Data Rooms.
Additional AI-Agents
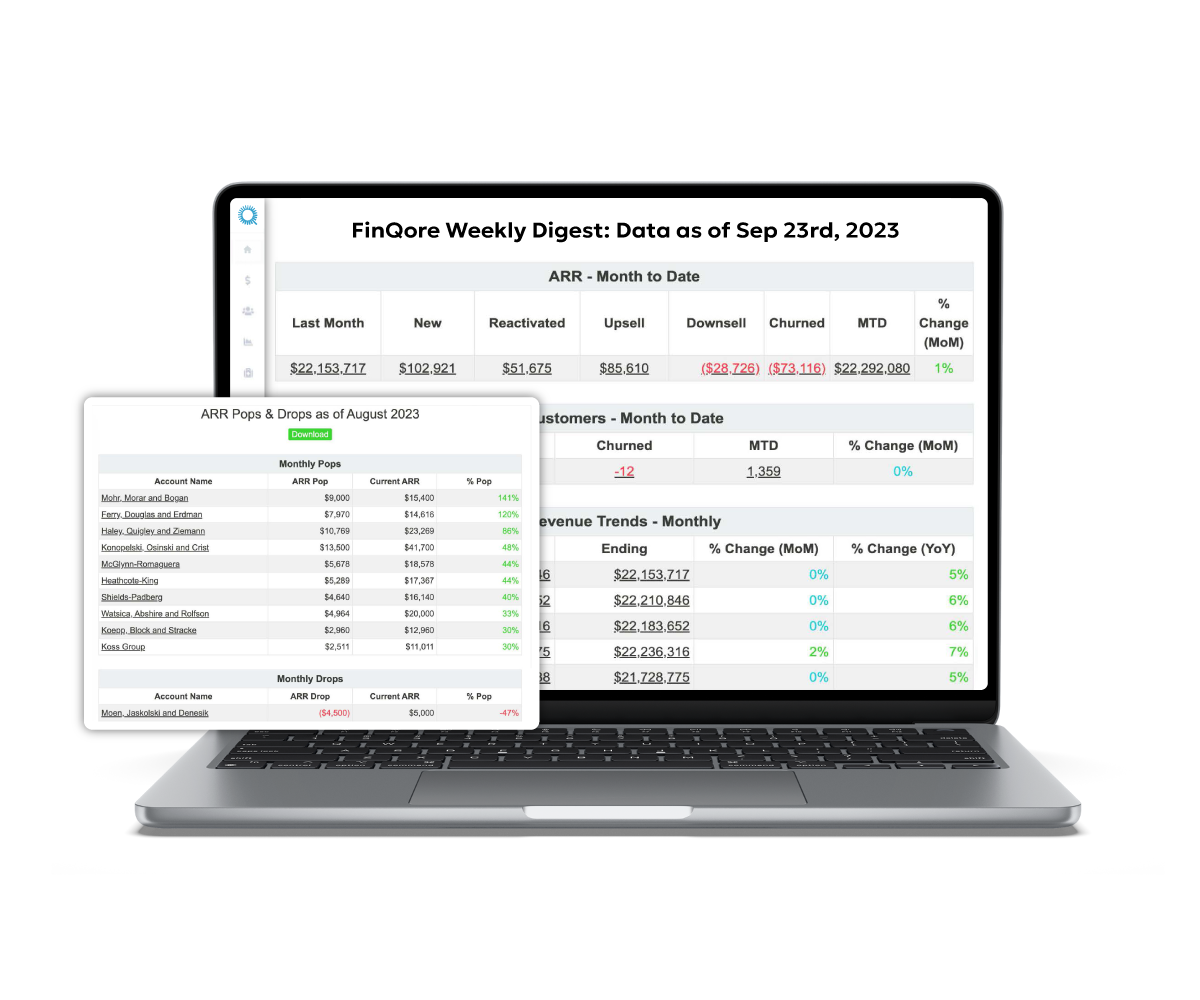
Metrics Digest
Features:
- Direct inbox delivery, with no user logins required for any systems and unlocks more time to action.
- Deeply segmented and smartly routed to (and for) people, product, revenue teams and leaders
- Monitors tailored trends to identify segment and cohort performance (e.g. Revenue Pop ‘N Drops)
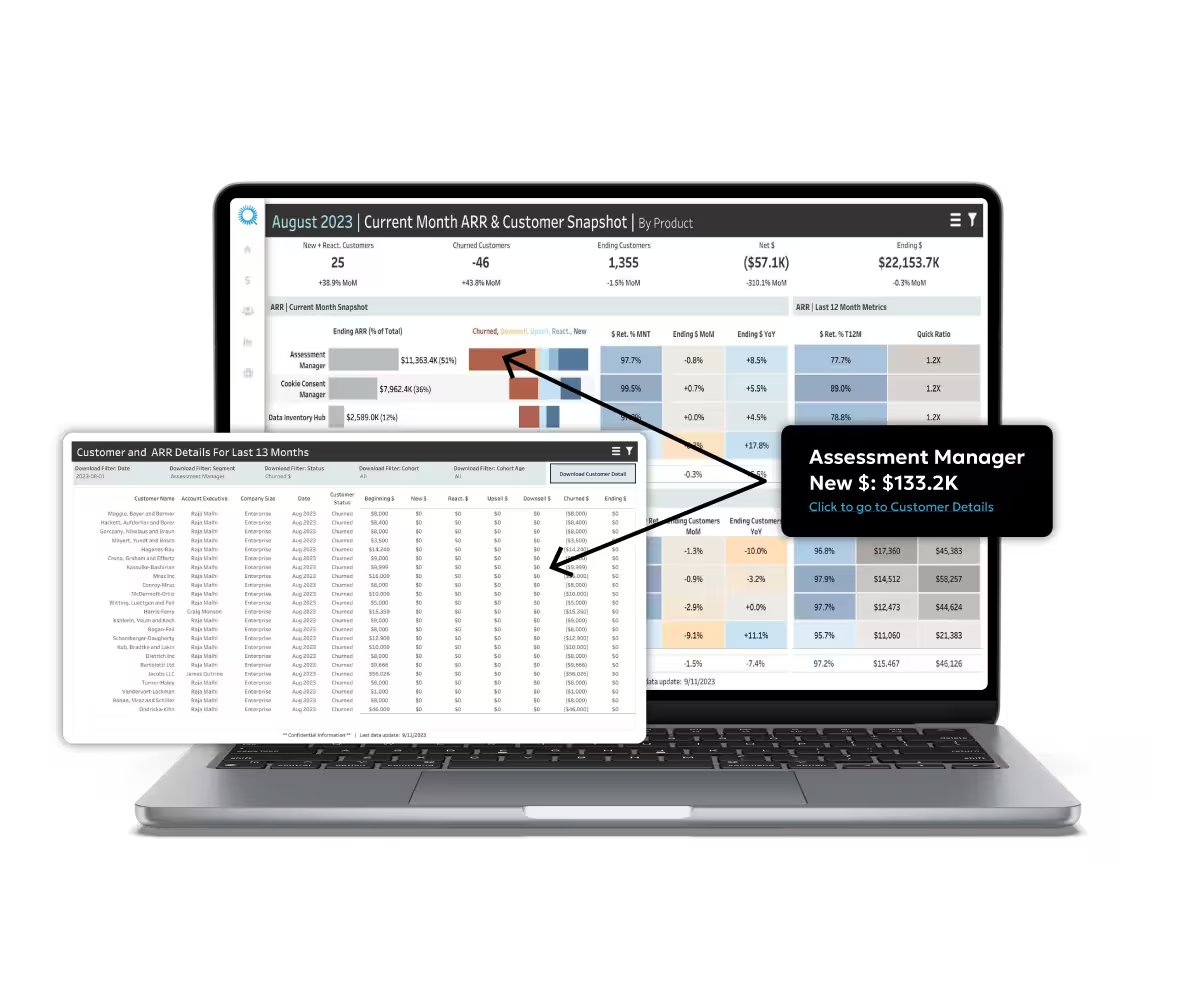
Clickable Analytics
Features:
- Drillable KPIs tailored to your business and revenue model (subscription, consumption, and services)
- Benchmark KPIs by segment: Revenue & Customer Growth, Gross & Net Retention, LTV, and more.
- 200+ visualizations for KPI trends, cohort charts, cohort curves, contribution analyses, and more.
Insights Deck
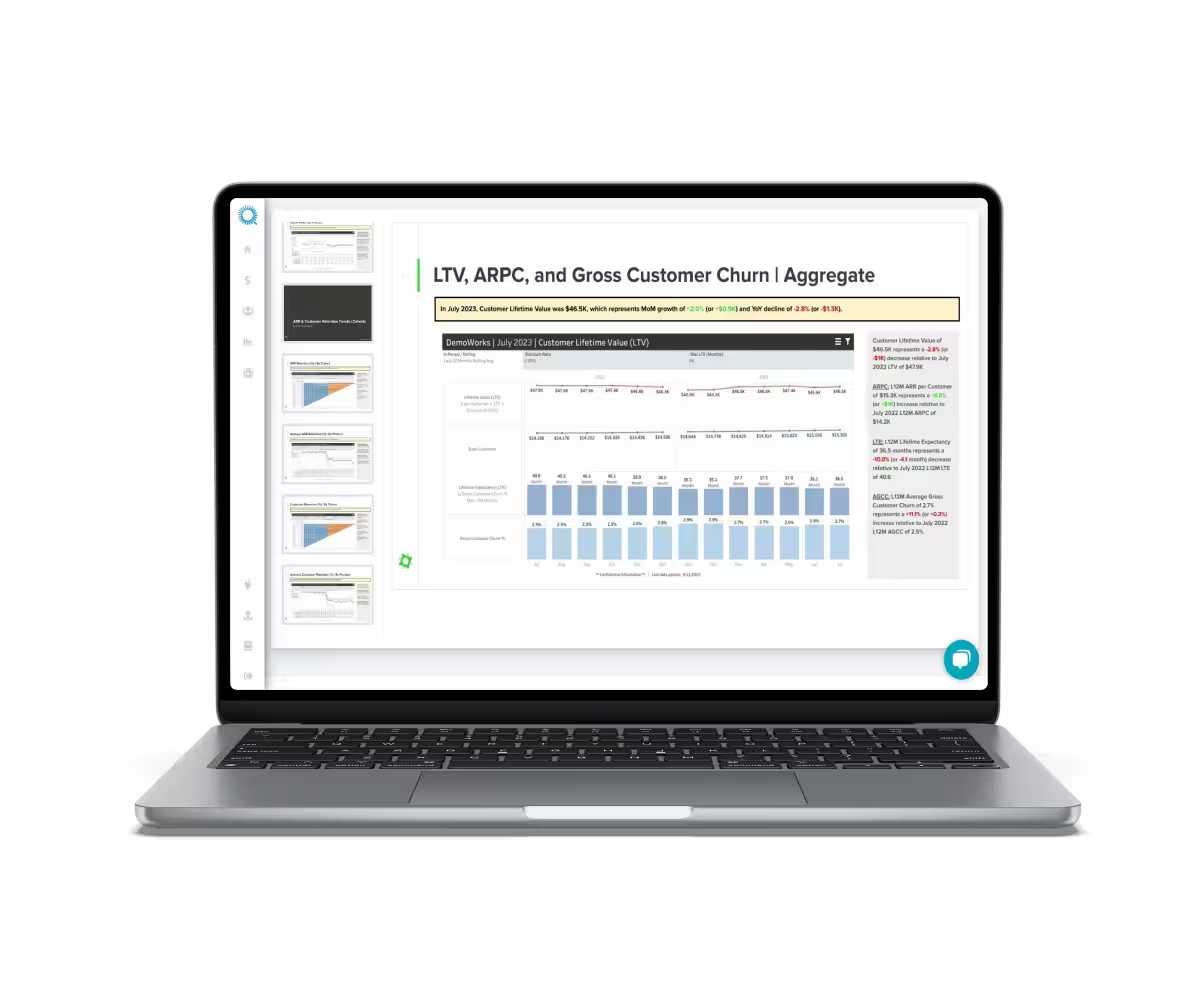
Features:
- Delivers a fully white labeled presentation in minutes and on-demand using your templates.
- Automates annotations by investigating and identifying revenue drivers by segment & cohort.
- Tailors outputs to meet the needs for Finance, Strategy, Investors, Board Members, and more.
Data Sync
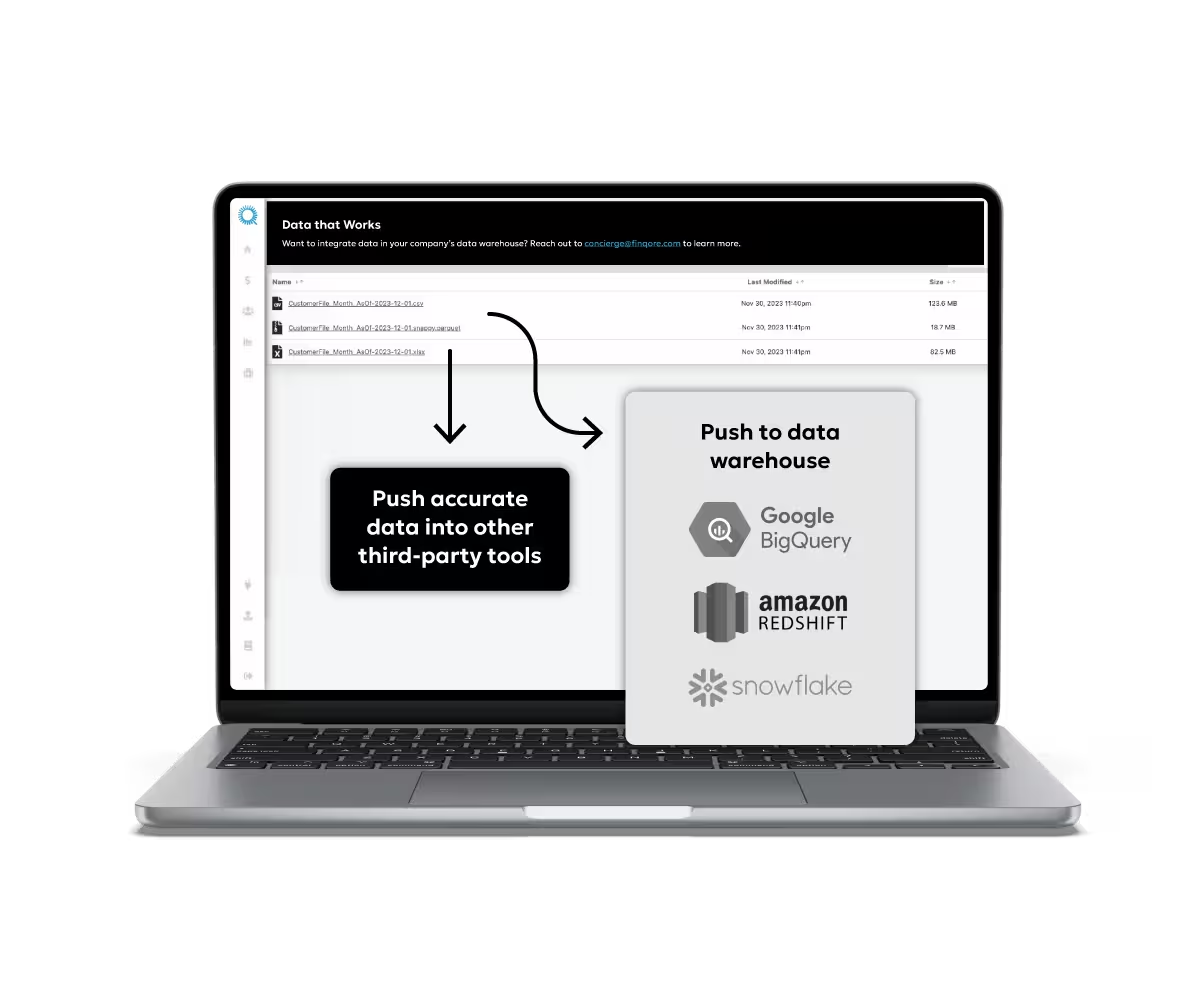
Features:
- Easily sync data back to your source systems, data warehouse, BI tools, and more.
- Populate accurate data into FP&A tools like Mosaic, Adaptive, Pigment, or in-house tools.
- Easy to download date in CSV, Excel, and Parquet formats.

Features:
- Direct inbox delivery, with no user logins required for any systems and unlocks more time to action.
- Deeply segmented and smartly routed to (and for) people, product, revenue teams and leaders
- Monitors tailored trends to identify segment and cohort performance (e.g. Revenue Pop ‘N Drops)

Features:
- Drillable KPIs tailored to your business and revenue model (subscription, consumption, and services)
- Benchmark KPIs by segment: Revenue & Customer Growth, Gross & Net Retention, LTV, and more.
- 200+ visualizations for KPI trends, cohort charts, cohort curves, contribution analyses, and more.

Features:
- Delivers a fully white labeled presentation in minutes and on-demand using your templates.
- Automates annotations by investigating and identifying revenue drivers by segment & cohort.
- Tailors outputs to meet the needs for Finance, Strategy, Investors, Board Members, and more.

Features:
- Easily sync data back to your source systems, data warehouse, BI tools, and more.
- Populate accurate data into FP&A tools like Mosaic, Adaptive, Pigment, or in-house tools.
- Easy to download date in CSV, Excel, and Parquet formats.

“With FinQore, we now have a fully automated and tailored Revenue & Customer Cube. The advanced FX and segmentation support ensures unparalleled visibility into our business. ”
Scott Wilson // Chief Financial Officer | Lux Research

“When I heard the FinQore value prop, it sounded too good to be true. It's the unique blend of data, software and expert analysis that made all the difference.”
Pam Martinez // Chief Financial Officer | SevenRooms

“Using FinQore is like grabbing some future organizational maturity and dragging it into the present.”
Michael Cavopol // VP of Customer Success | Fresh
.avif)
“With FinQore we have a tailored solution that equips us with reliable data, analytics, and insights to optimize revenue, drive strategy and streamline reporting.”
Robert Dillon // Chief Financial Officer | Incorta

“FinQore data is the source of most of the analyses we conduct. With this solid foundation, we have been able to identify important customer segments, key business drivers and trends by segment. We have used this data to guide decision making and priorities, and we're able to measure the success of these decisions via a targeted set of metrics that matter the most for our business.”
Silvia Borzini // Chief Financial Officer | Office Timeline


